A more complex ODE model
This example shows how to formulate and simulate a model with ordinary differential equations (ODE) in SUND.
Model file
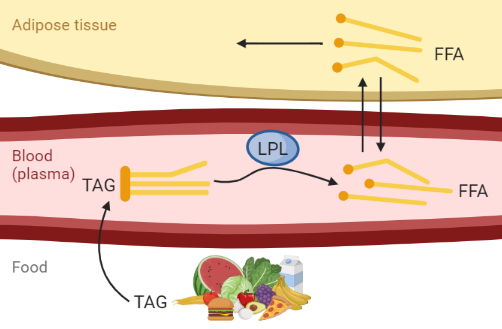
The ODE model is a simple mathematical model of the fat metabolism, describing fat uptake in the blood and adipose tissue after a meal. A biological description of the model is shown in Figure 1. Specifically, the model covers the dynamics of concentrations of triglycerides (TAG) and free fatty acids (FFA) and allows for a meal with a certain amount of triglycerides as an input to the model.

Figure 1: Biological description of the model, describing fat uptake from a meal. Created with BioRender.com
The full model file is shown below, and can be downloaded here: fat model.
########## NAME
ode_fat
########## METADATA
time_unit = m
########## MACROS
########## STATES
d/dt(TAGfood) = -vfatUptake                                     // umol/min (no volume, just amount)
d/dt(TAGp) = vfatUptake/Vplasma - vLPL                          // umol/L/min
d/dt(FFAp)=  vLPL*3 - vnetDiffusion                             // umol/L/min
d/dt(FFAt)= vnetDiffusion*(Vplasma/Vtissue) - vFatUtalization   // umol/L/min

TAGfood(0) = 0 // umol
TAGp(0) = 0    // umol/L
FFAp(0) = 0    // umol/L
FFAt(0) = 0    // umol/L

########## PARAMETERS
kf = 0.015    // 1/min
vmax = 17     // umol/L/min
km = 100      // umol/L
kd = 0.08     // 1/min diffusion rate constant
ku = 1        // 1/min
Vtissue = 1.2 // L
Vplasma = 3   // L

########## VARIABLES
vnetDiffusion = kd*FFAp - kd*FFAt
vLPL = TAGp*vmax/(TAGp+km)
vFatUtalization = FFAt*ku
vfatUptake = TAGfood*kf

########## FUNCTIONS
########## EVENTS
foodevent = food > 0, TAGfood, food+TAGfood  // if food is given as input, TAGfood is set to food

########## OUTPUTS
########## INPUTS
food = food_in @ 0 // @ 0 means that food has the value 0 if food_in is not given as input

########## FEATURES
TAG in food = TAGfood   [umol]
TAG in plasma = TAGp    [umol/L]
FFA in tissue = FFAt    [umol/L]
FFA in plasma = FFAp    [umol/L]

LPL reaction rate = vLPL                [umol/L/min]
Fat uptake rate = vfatUptake            [umol/min]
Fat utilization rate = vFatUtalization  [umol/L/min]
Net diffusion rate = vnetDiffusion      [umol/L/min]
Simulating the model
The ODE model is simulated in the same way as any other model object in SUND, by installing and importing the model and then creating a simulation object which can be simulated.
Meal input as an activity
The food uptake is modelled as follows:
########## STATES
d/dt(TAGfood) = -vfatUptake

########## VARIABLES
vfatUptake = TAGfood*kf

########## EVENTS
foodevent = food > 0, TAGfood, food+TAGfood  // if food is given as input, TAGfood is set to food

########## INPUTS
food = food_in @ 0 // @ 0 means that food has the value 0 if food_in is not given as input
TAGfood is the amount of triglycerides from the food left in the stomach in \(\mu\)mol, the variable \(vfatUptake\) is the reaction of TAG transferred from the food into the blood, and \(kf\) is a parameter describing the rate of food uptake in min\(^{-1}\).
The input of food is governed by the input variable food_in which is 0 at default, and is set from the simulation object using a piecewise_constant activity. This activity sets food to any value(s) f at any time(s) t.
# Create an activity which sets the food input to 6000 at time 1
meal1 = sund.Activity(time_unit='m')
meal1.add_output(sund.PIECEWISE_CONSTANT, "food_in", t = [1], f=[0,6000])
Finally, an event is used to add the triglycerides in food_in to the state TAG_food whenever the value of food_in changes from the default value of 0 to any value larger than 0.
Full python code to run the example
The full code to run the example is shown below, but it can also be downloaded here.
Requirements
To run this example code, the following python packages are needed to be installed in addition to the sund package
uv add numpy matplotlib
pip install numpy matplotlib
Example code
import math
import os

import matplotlib.pyplot as plt
import numpy as np

import sund

os.makedirs('./modelfiles', exist_ok=True) # Create the folder if it does not exist

MODEL_NAME = "ode_fat"

#%% Import and load the model
sund.install_model(f'modelfiles/{MODEL_NAME}.txt')
fat_model = sund.load_model(MODEL_NAME)

#%% Create simulation objects
# Create activity which sets the food input to 6000 at time 1
meal1 = sund.Activity(time_unit='m')
meal1.add_output(sund.PIECEWISE_CONSTANT, "food_in", t = [1], f=[0,6000])

# Create activity which sets the food input to 12000 at time 10 and to 4000 at time 60
# Note that it is reset to 0 in between the meals in order for the food event to trigger
meal2 = sund.Activity(time_unit='m')
meal2.add_output(sund.PIECEWISE_CONSTANT, "food_in", t = [10,15,60], f=[0,12000,0,4000])

# Create simulation objects with the different meal inputs: create a dictionary containing the simulation objects
sims = {} # Create an empty dictionary
sims['one meal']  = sund.Simulation(models = fat_model, activities = meal1, time_unit = 'm') # create a new simulation object and add it to the dictionary
sims['two meals'] = sund.Simulation(models = fat_model, activities = meal2, time_unit = 'm') # create a new simulation object and add it to the dictionary

#%% Run the simulation
timepoints = np.arange(0, 400, 1) # Time in minutes (starting at  t=0 and ending at t=400, with steps of 1)

# Do a simulation for each simulation object in the dictionary, using the parameter values from the simulation object.
for sim in sims:
    sims[sim].simulate(time_vector = timepoints, reset = True)

#%% Plot all features in the resulting simulations

# First, define a simple plotting function
def plot_features(sims, figname='',features_to_plot=[]):
    if not features_to_plot:
        plotfeatures = sims.next().feature_names
    else:
        plotfeatures=features_to_plot

    numcols = 2
    numrows = int(math.ceil(len(plotfeatures)/numcols))
    cm = 1/2.54  # centimeters in inches
    fig=plt.figure(f"{figname}",figsize=(20*cm, 4*numrows*cm),layout="constrained")
    for idx, feature in enumerate(plotfeatures):
        plt.subplot(numrows, numcols, idx+1)
        for experiment in sims:
            feature_idx = sims[experiment].feature_names.index(feature)
            plt.plot(sims[experiment].time_vector, sims[experiment].feature_data[:,feature_idx],label=experiment)
        plt.xlabel(f"Time ({sims[experiment].time_unit})")
        plt.ylabel(f"{feature} ({sims[experiment].feature_units[feature_idx]})")
        plt.legend()
    #fig.constrained_layout()

# Then, call the plotting function
plot_features(sims,figname='All features',features_to_plot=fat_model.feature_names)
plt.show()